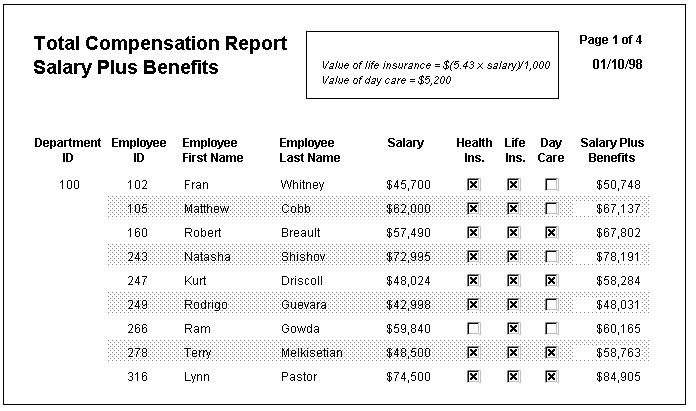
Example 1: creating a gray bar effect
The following DataWindow object shows alternate rows with a light
gray bar. The gray bars make it easier to track data values across
the row:
Adding a rectangle control
To create the gray bar effect, you would add a rectangle control
to the detail band and size it so that it surrounds the controls
you want highlighted. The rectangle needs to be located in the band
(for the rectangle, the Properties view>Position tab>Layer
option>Band setting). The rectangle also needs to be specified
as Send to Back (select from the popup menu) so that it will be
behind all the values:

At this point, the DataWindow object shows a rectangle for each detail
line. A narrow black line bounds the rectangle:

The line bounding the rectangle should be set to No Visible
Line (Rectangle property sheet>General tab>Pen
Style option>No Visible Line setting). You would do this
last, after positioning the rectangle control.
At this point the DataWindow object looks as it did originally without
the rectangles in the detail lines. The rectangles are there but
because they are white and are not bounded with a black line, you
cannot see them.
Specifying the condition
Now you would specify the condition for making the rectangle
gray. To do this, you would click the button next to the Brush Color
property on the General property page. In the Modify Expression
dialog box, you would enter the following expression for the Brush.Color
property:
|
1 |
If(mod(getrow(),2 )=1, rgb(255, 255, 255 ), rgb(240, 240, 240 )) |
The expression mod(getrow(),2 )=1
distinguishes
odd rows from even rows.
The function mod(getrow(),2)
takes the
row number (getrow()
), divides it by 2
, then
returns the remainder. The remainder can be either 0 or 1. If the
row number is odd, mod returns 1; if the row number is even, mod
returns 0.
If the row number is odd (the condition evaluates as true),
the rectangle displays as white. The rgb function specifies maximum
amounts of red, green, and blue: rgb (255, 255, 255)
.
Specifying 255 for red, green, and blue results in the color white.
If the row number is even (the condition evaluates as false), the
rectangle displays as light gray (rgb (240, 240, 240)
).
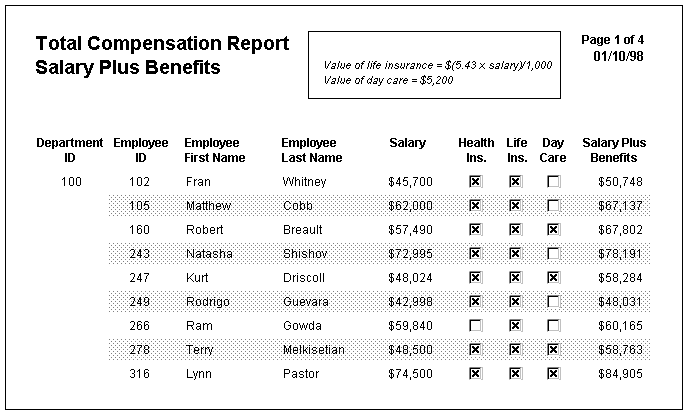
Finishing up
Now the DataWindow object has gray bands. The final adjustment in
this example is to change the background color of the computed field
used for Salary Plus Benefits. Change the background color of the
computed field from white to transparent (Computed field property
sheet>Font tab>Background Color option>Transparent):