Enabling debugging for your deployment configuration
Before you can debug
a project, you need to create a deployment configuration for a PowerDynamo
application server. You then select this deployment configuration
as your debugging configuration and specify the starting page for your
Web site.
For more information, see “Adding deployment and
debugging configurations “.
If you use the Dynamo Web Site target wizard, you can enable
debugging when you create your deployment configuration. But it
is still possible that you will want to turn debugging on and off
at various times while you’re testing your Web site, and
you will still need to select the start page for the debugging configuration
and the type of scripts you want to debug.
![]() To enable debugging for your deployment configuration
To enable debugging for your deployment configuration
-
On the Deploy page of the Target Properties
dialog box, select the deployment configuration you want to use
for debugging. -
Click the Edit Configuration button.
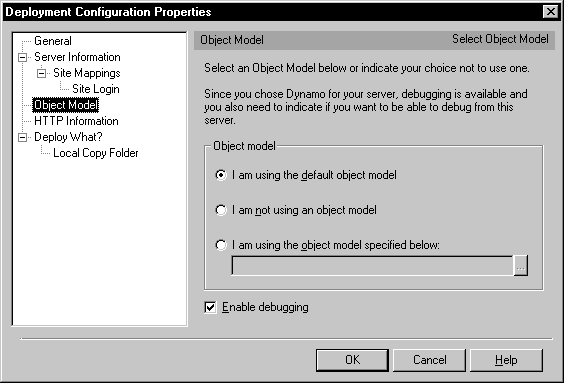
The Deployment Configuration Properties dialog box displays.
-
Click Object Model in the left pane and make sure
the Enable Debugging checkbox is selected in the right pane.
-
Click OK
Click the Run/Debug tab of the Target Properties
dialog box. -
Make sure the configuration you want to use for
debugging is selected in the Deploy Configuration For Running/Debugging
dropdown listbox. -
Select or type a start page for your Web target.
You can enter a relative URL if you selected an HTTP server
name and port for your deployment configuration. Relative URLs must
start with a forward slash. For example: /files/first.htm
. -
Select checkboxes for the type of script you want
to debug.You can select both Client Side Scripts and Server Side Scripts
for debugging. -
Select the Local Server radio button if your Web
server is on your local machine.or
Select the Remote Server radio button if your Web server
is on a remote machine, and type the target machine name or IP address
in the textbox beneath the radio button. -
Click OK to save any changes to your Web target
properties.