Debugging a .NET application
After you have deployed
a PowerBuilder Web Forms or Windows Forms application, you can debug
it. To launch the application and open the debugger, right-click
the target or project in the System Tree and select Debug from its pop-up
menu. You can also select the Debug Project button or the Design>Debug
Project menu item in the Project painter, or the Debug button in
the PainterBar.
.NET debugger restrictions
The .NET debugger supports most features of the debugger for
standard PowerBuilder applications, including expression evaluation
and conditional breakpoints. It does not support the Objects in
Memory view or variable breakpoints, which are not supported in
.NET. Local variables that are declared but not used do not display
in the Local Variables view in .NET targets.
Additional debugging restrictions include the following:
- Debugger icon display in .NET Web Forms
projects When you close a .NET Web Forms application that is being
debugged, the Stop Debugging icon remains enabled in the debugger,
and the StartDebugging icon is disabled. - Single-stepping between events In the .NET debugger, when you step into a statement or function
in an event script, the debugger displays the next line of code.
However, if you step into a different event script, the debugger
continues execution to the next breakpoint. You should add a breakpoint
to each event that you want to debug.
For example, if you have set a breakpoint in the application’s
Open event, and the script opens a window, the debugger does not
step into the window’s Open event. You should set a breakpoint
in the window’s Open event or in a user-defined event that
is called from the Open event. - Setting breakpoints in modified code If you modify your code after successfully debugging a .NET
application, you must redeploy the application before you debug
it again. Although you can still set breakpoints in modified lines
of code before you redeploy an application, the debugger debugs
only the last deployed version of your application. - Server support restrictions for .NET
Web Forms projects The .NET debugger does not support IIS 6 if the maximum number
of worker processes is set to greater than one. This is because
it cannot determine whether the process to be debugged is newly
created or is recycled from a pool of worker processes. (The debugger
must attach to the worker process in Web garden mode.) It also does
not support the Cassini Web server that ships with .NET Framework
2.0. - Multiple applications using the same
PBLs When you run or debug a Web Forms application, its PBLs can
remain cached in the ASP.NET process. If you then try to debug a
second Web Forms application that shares a PBL with the first application,
the ASP.NET process lets the debugger know that the first module
is loaded and the debugger binds to breakpoints in that module.
In this case, the debugger never binds to breakpoints in the second
application. You can avoid this issue by not sharing PBLs among
Web Forms projects or by restarting IIS before you begin debugging. - Remote debugging Debugging of Web Forms or Web Service targets is not supported
for applications or components deployed to remote IIS servers.
For information about standard PowerBuilder debugger features,
see “Debugging an application” in the User’s
Guide
.
Release and Debug builds
On the General page in the Project painter,
you can choose to build a release build or a debug build. If you
choose a debug build, an extra file with the extension .PDB is generated
in the output directory and additional information displays in the
Output window. If you want to stop at breakpoints in your code, you
must use a debug build. Select a release build when your application
is ready to distribute to users.
DEBUG preprocessor symbol
You can also enable or disable
the DEBUG preprocessor symbol. This is useful if you want to add
code to your application to help you debug while testing the application.
Although you do not typically enable the DEBUG symbol in a release
build, if a problem is reported in a production application, you
can redeploy the release build with the DEBUG symbol enabled to
help determine the nature or location of the problem.
When the DEBUG symbol is enabled, code that is enclosed in
a code block with the following format is parsed by the pb2cs code
emitter:
|
1 |
#if defined DEBUG then<br /> /*debugging code*/<br />#else<br /> /* other action*/<br />#end if |
 Adding breakpoints in a DEBUG block When you use the DEBUG symbol, you can add breakpoints in
the DEBUG block only for lines of code that are not in an ELSE clause
that removes the DEBUG condition. If you attempt to add a breakpoint
in the ELSE clause, the debugger automatically switches the breakpoint
to the last line of the clause defining the DEBUG condition.
In the previous pseudocode example, if you add a breakpoint
to the comment line “/* other
action*/“, the breakpoint
automatically switches to the “/*debugging
code*/” comment line.
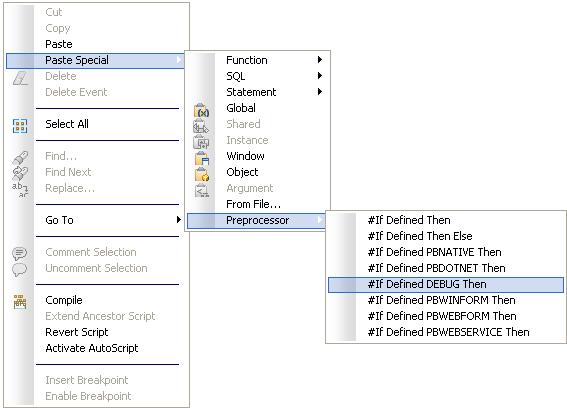
Figure 17-1 shows
the pop-up menu item that you can use to paste the #If Defined
DEBUG Then template statement in the Script view.
a template into a script
For more information about using preprocessor symbols, see “About conditional compilation”.
Attaching to a running Windows Forms process
For Windows Forms projects, you can start your deployed application
from its executable file before starting the debugger, and then
attach to the running process from the debugger. To attach to a
process that is already running, select Run>Attach to .NET
Process in the Project painter to open a dialog box from which you
can select the process.
After you attach to the process, it starts running in the
debugger and you can set breakpoints as you normally do. Select
Run>Detach to detach from the process. This gives you more
flexibility than simply using just-in-time (JIT) debugging.
Breaking into the debugger when an exception is
thrown
When an application throws an exception while it is being
debugged, the debugger sees the exception before the program has
a chance to handle it.The debugger can allow the program to continue,
or it can handle the exception. This is usually referred to as the
debugger’s first chance to handle the exception. If the
debugger does not handle the exception, the program sees the exception.
If the program does not handle the exception, the debugger gets
a second chance to handle it.
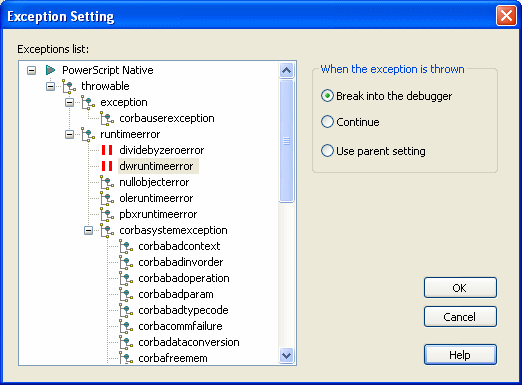
You can control whether the debugger handles first-chance
exceptions in the Exception Setting dialog box. To open the dialog
box, open the Debugger and select Exceptions from the Debug menu.
By default, all exceptions inherit from their parent and all are
set to Continue. Figure 17-2 shows the DWRuntimeError exception
has been set to “Break into the debugger.”
box
When this exception is thrown, a dialog box displays so that
you can choose whether to open the debugger or pass the exception
to the program.