Three-dimensional graphs
Traditional 3D graphs
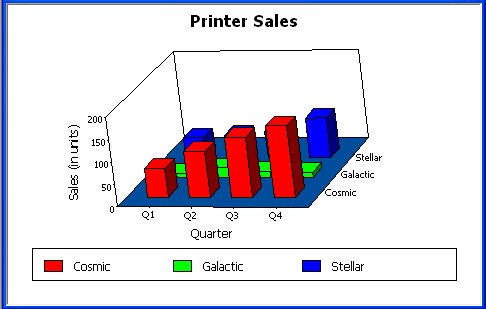
You can also create 3-dimensional (3D) graphs of area, bar,
column, line, and pie graphs. In 3D graphs (except for 3D pie
graphs), series are plotted along a third axis (the Series axis)
instead of along the Category axis. You can specify the perspective
to use to show the third dimension:
DirectX 3D graphs
DirectX 3D rendering allows you to display the 3D graphs
(Pie3D, Bar3D, Column3D, Line3D, and Area3D) with a more
sophisticated look. You can use data item or series transparency
with the DirectX graph styles to improve the presentation of
data.
The DirectX graph rendering style is supported for standalone
graph controls and for graph controls in a DataWindow object.
PowerBuilder uses the following functions to support the DirectX
graph styles:
|
GetDataLabelling |
SetDataLabelling |
|---|---|
|
GetDataTransparency |
SetDataTransparency |
|
GetSeriesLabelling |
SetSeriesLabelling |
|
GetSeriesTransparency |
SetSeriesTransparency |
DirectX runtime. The DirectX 3D rendering depends on the DirectX runtime. The
first time you select the Render3D check box on the General tab of
the Properties view for a 3D graph, PowerBuilder launches the
DirectX installer. If you opt out of the installation, the
Render3D property is ignored. End users of PowerBuilder
applications must also have the DirectX runtime installed on their
computers.
If you install DirectX on the runtime computer, but selecting
the Render3D check box does not change the appearance of the graph,
it is possible that the graphics card does not support
DirectX.
You can check whether DirectX is supported by running
dxdiag.exe. This file is typically installed in the WindowsSystem32
directory. The Display tab of the DirectX Diagnostic Tool that opens
when you run dxdiag.exe indicates whether Direct3D is
enabled.