Populating a graph with
data
This section shows how you can populate an empty graph with
data.
Using AddSeries
You use AddSeries to create a series. AddSeries has this
syntax:
|
1 |
graphName.AddSeries ( seriesName ) |
AddSeries returns an integer that identifies the series that was
created. The first series is numbered 1, the second is 2, and so on.
Typically you use this number as the first argument in other graph
functions that manipulate the series.
So to create a series named Stellar, code:
|
1 2 |
int SNum SNum = gr_1.AddSeries("Stellar") |
Using AddData
You use AddData to add data points to a specified series.
AddData has this syntax:
|
1 |
graphName.AddData ( seriesNumber, value, categoryLabel ) |
The first argument to AddData is the number assigned by PowerBuilder
to the series. So to add two data points to the Stellar series, whose
number is stored by the variable SNum (as shown above), code:
|
1 2 |
gr_1.AddData(SNum, 12, "Q1") // Category is Q1 gr_1.AddData(SNum, 14, "Q2") // Category is Q2 |
Getting a series number
You can use the FindSeries function to determine the number
PowerBuilder has assigned to a series. FindSeries returns the series
number. This is useful when you write general-purpose functions to
manipulate graphs.
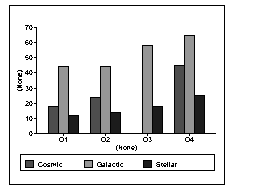
An example
Say you want to graph quarterly printer sales. Here is a script that
populates the graph with data:
|
1 2 3 4 5 6 7 8 9 10 11 12 13 14 15 16 17 18 19 20 21 22 23 |
gr_1.Reset( All! ) // Resets the graph. // Create first series and populate with data. int SNum SNum = gr_1.AddSeries("Stellar") gr_1.AddData(SNum, 12, "Q1") // Category is Q1. gr_1.AddData(SNum, 14, "Q2") // Category is Q2. gr_1.Adddata(SNum, 18, "Q3") // Category is Q3. gr_1.AddData(SNum, 25, "Q4") // Category is Q4. // Create second series and populate with data. SNum = gr_1.AddSeries("Cosmic") // Use the same categories as for series 1 so the data // appears next to the series 1 data. gr_1.AddData(SNum, 18, "Q1") gr_1.AddData(SNum, 24, "Q2") gr_1.Adddata(SNum, 38, "Q3") gr_1.AddData(SNum, 45, "Q4") // Create third series and populate with data. SNum = gr_1.AddSeries("Galactic") gr_1.AddData(SNum, 44, "Q1") gr_1.AddData(SNum, 44, "Q2") gr_1.Adddata(SNum, 58, "Q3") gr_1.AddData(SNum, 65, "Q4") |
Here is the resulting graph:
You can add, modify, and delete data in a graph in a window through
graph functions anytime during execution.
For more information
For complete information about each graph function, see PowerScript Reference.