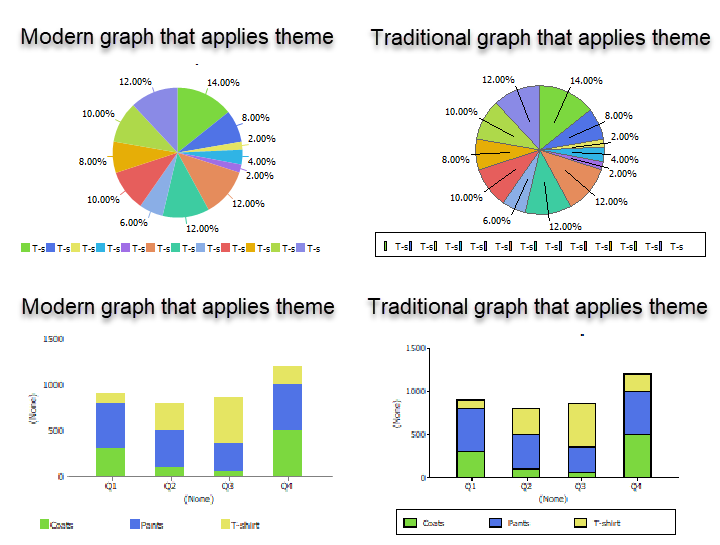
Modern graphs vs. traditional graphs
The overall display of graphs have been improved from the
following aspects:
-
The 14 old colors of the original graph have been replaced
with a new color scheme that follows the current mainstream
style.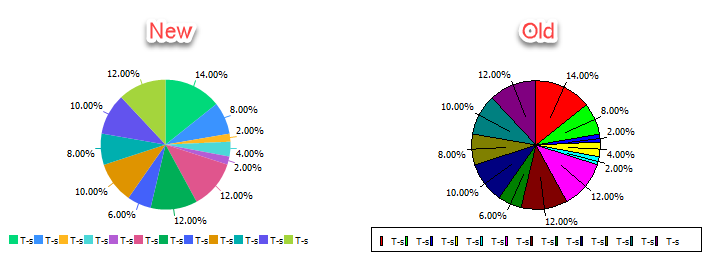
-
The new style graph not only has a more flat and modern
design, but also utilizes upgraded technology GDI+ to make the
lines smoother and eliminate jagged edges. -
The 3D style graph only supports the new color scheme, while
the line style remains in the original traditional style.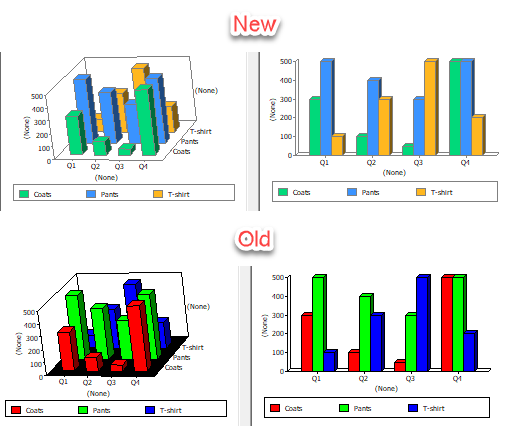
-
The solid lines for the Value axis and the border for the
legend in 2D style bar charts and histograms have been
removed.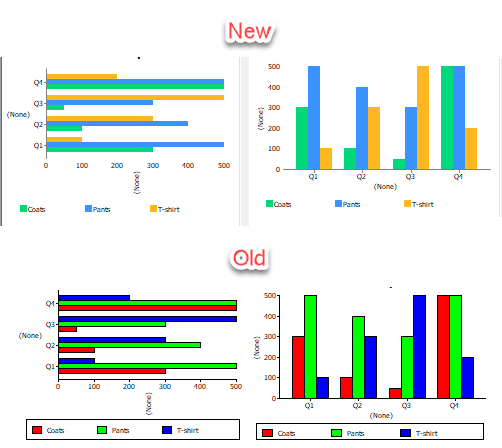
-
The default hollow box symbolvalue for line charts has been
replaced with a fixed hollow dot, and changing the symbolvalue is
no longer supported.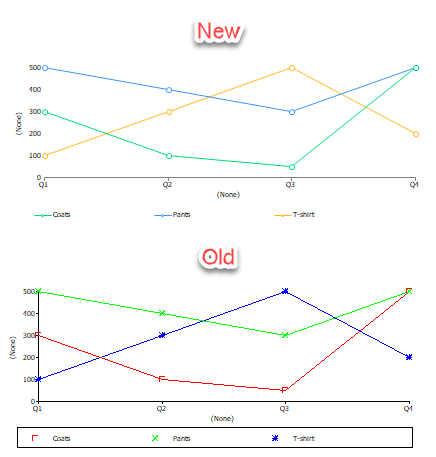
-
The values in scatter plots have been replaced with solid
dots.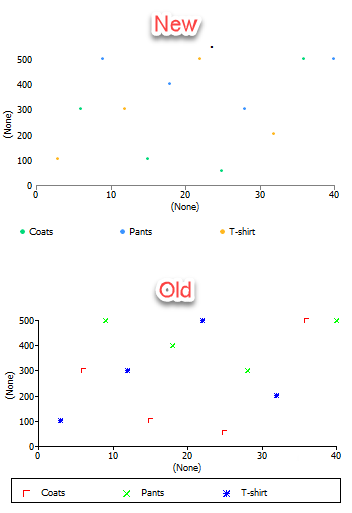
-
When both modern graph style and theme are applied, the
color scheme from theme takes precedence, while the line style for
2D style graphs uses the modern style.