How to use Visual Studio to debug a C/C++ dynamic library called
by a PowerBuilder 2019 application
Background
This article aims to give an instruction on how to use Visual
Studio to debug a C/C++ dynamic library that is called by a PowerBuilder
2019 application.
Here we will show you:
-
How to create a C/C++ dynamic library.
-
How to call this DLL in PowerBuilder application.
-
How to debug the DLL called by the PowerBuilder
application.
Description
Let’s take Visual Studio 2017 as an example to create a C/C++
dynamic library NewDLL.dll, which contains two functions:
-
Add: Accepts two int parameters.
-
ComputerName: Accepts a string parameter.
In addition, we will create a simple application with PowerBuilder
2019 to call this NewDLL.dll.
How to create a simple C/C++ dynamic
library
1. Start Visual Studio 2017. Select File -> New -> Project
to create a NewDLL project
Select Dynamic-Link Library (DLL) from the listed
items.

2. Open the pre-compiled header file pch.h.
Add export interface code as shown below:

|
1 2 3 4 5 |
extern "C" { int __stdcall Add(int, int); BOOLEAN __stdcall ComputerName(LPTSTR); } |
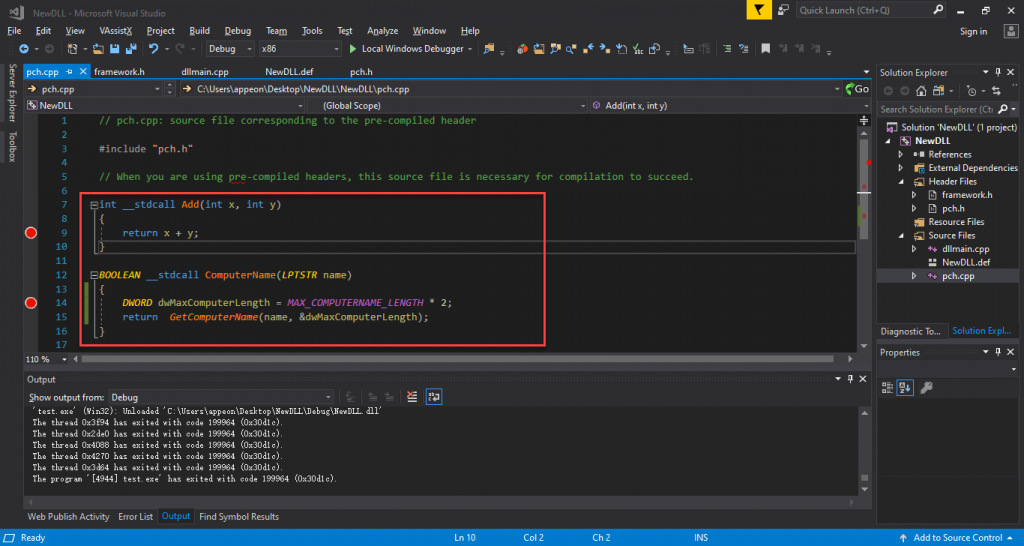
3. Modify the source file pch.cpp corresponding to the
pre-compiled header file.
Add export interface implementation code as shown
below:
|
1 2 3 4 5 6 7 8 9 |
int __stdcall Add(int x, int y) { return x + y; } BOOLEAN __stdcall fnWelcome(LPTSTR name) { DWORD dwMaxComputerLength = MAX_COMPUTERNAME_LENGTH * 2; return GetComputerName(name, &dwMaxComputerLength); } |
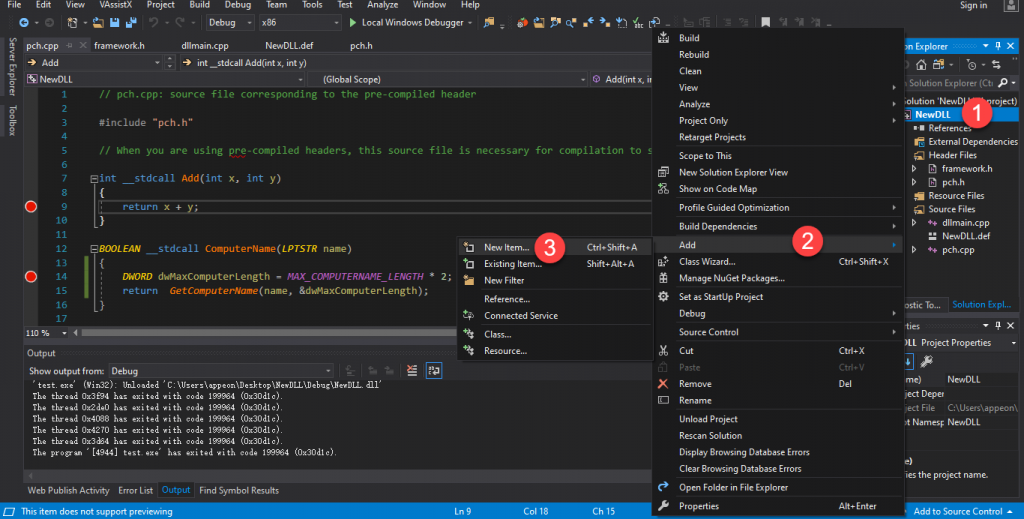
4. Add a def file to declare the export interface function.
Right-click the current NewDLL project and select Add ->
New Item from the pop-up menu.
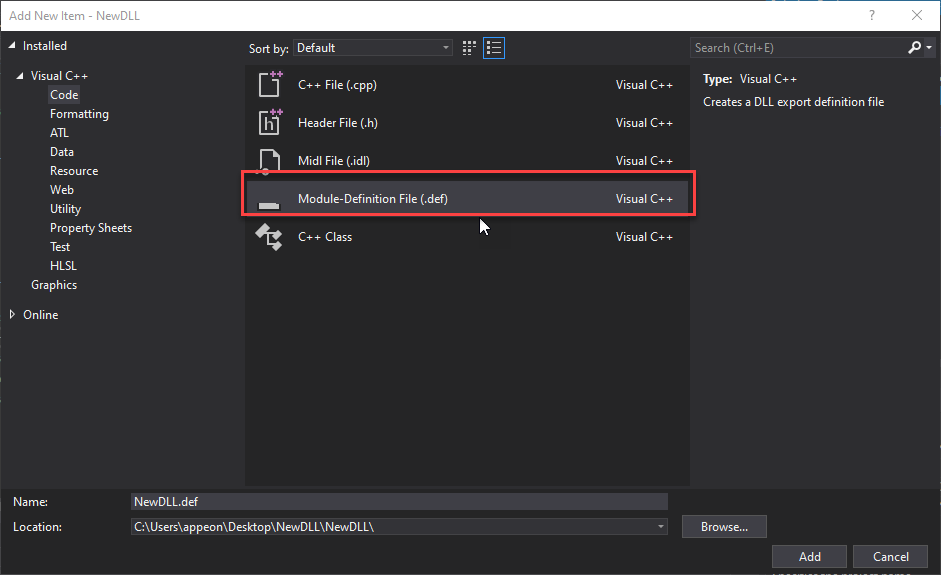
Select Module-Definition File (.def) from the listed
items.
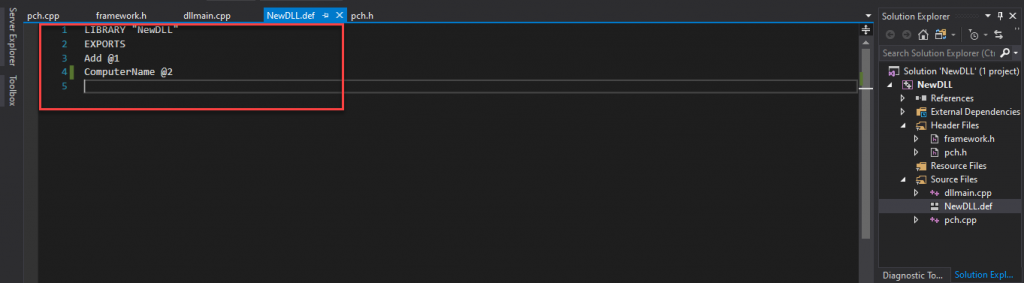
5. Modify this def file and add the export interface
functions.
Create a PowerBuilder application to call
this C/C++ dynamic library
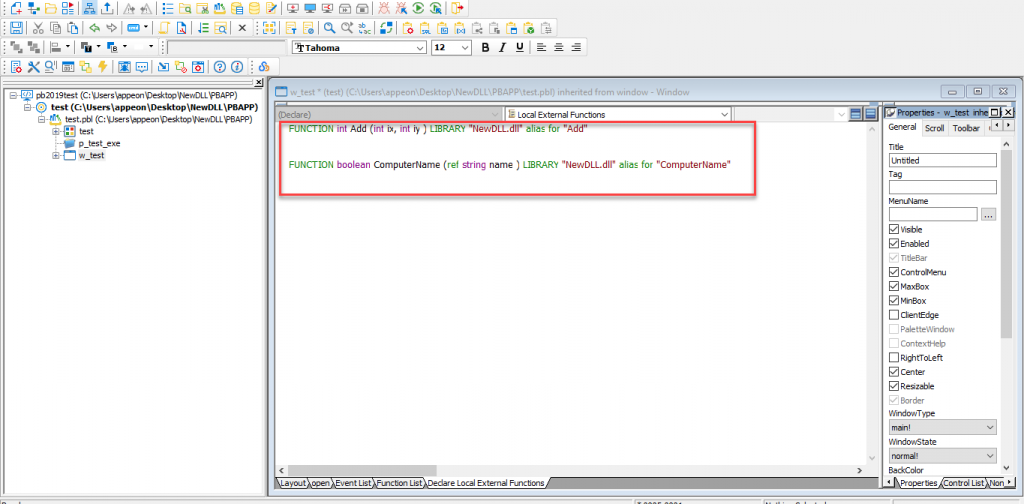
1. Create a new PB application. Add a window and declare local
external functions in it as shown below:
|
1 2 |
FUNCTION int Add (int ix, int iy ) LIBRARY "NewDLL.dll" alias for "Add" FUNCTION boolean ComputerName (ref string name ) LIBRARY "NewDLL.dll" alias for "ComputerName" |
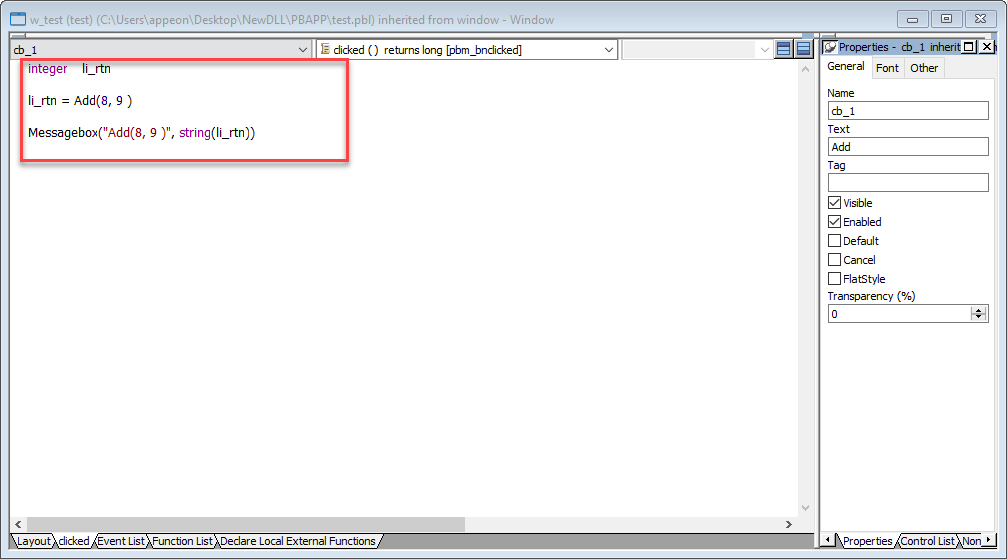
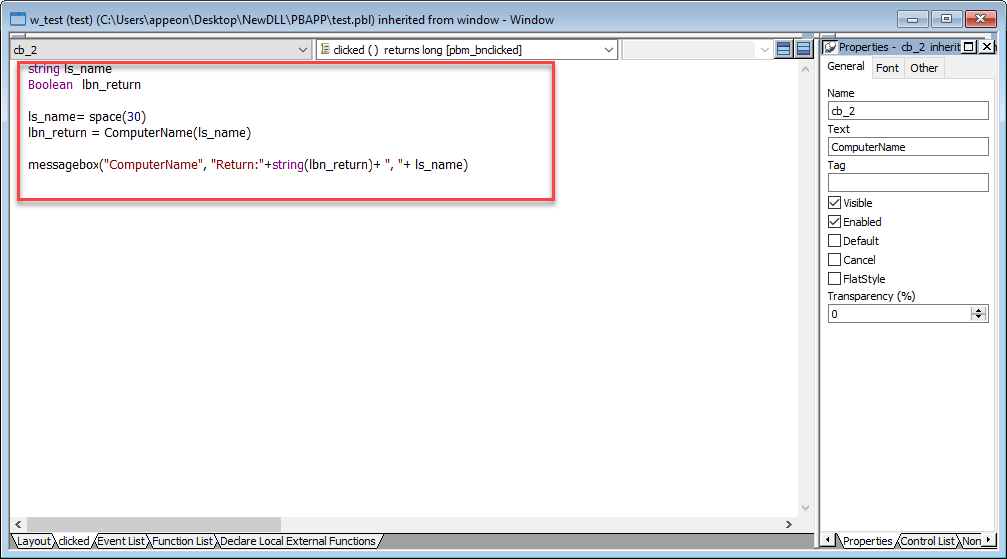
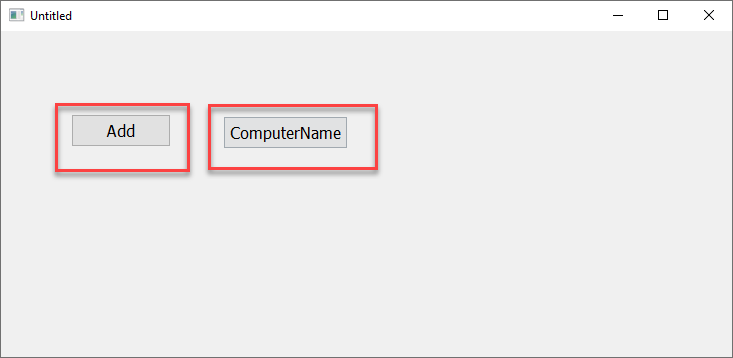
2. Add an Add button and a ComputerName button on the current
window to call the functions from the DLL.
|
1 2 3 |
integer li_rtn li_rtn = Add(8, 9 ) Messagebox("Add(8, 9 )", string(li_rtn)) |
|
1 2 3 4 5 |
string ls_name Boolean lbn_return ls_name= space(30) //Initializes the memory space lbn_return = ComputerName(ls_name) messagebox("ComputerName", "Return:"+string(lbn_return)+ ", "+ ls_name) |
At this moment, you can deploy the application into an exe file or
directly run the application in PowerBuilder IDE to check the execution
of the current functions.
Use Visual Studio to debug the DLL called by the PowerBuilder
application
In most circumstances, when we compile a DLL for PowerBuilder
applications, the most troubling part is to debug the functions from the
DLL.
So going forward, we will show you how to use the debug
function.
Note: In most cases, users cannot use Visual Studio to debug the
DLL called by the PowerBuilder application because the corresponding pdb
file is not copied to the same PowerBuilder application directory after
compiling the DLL.
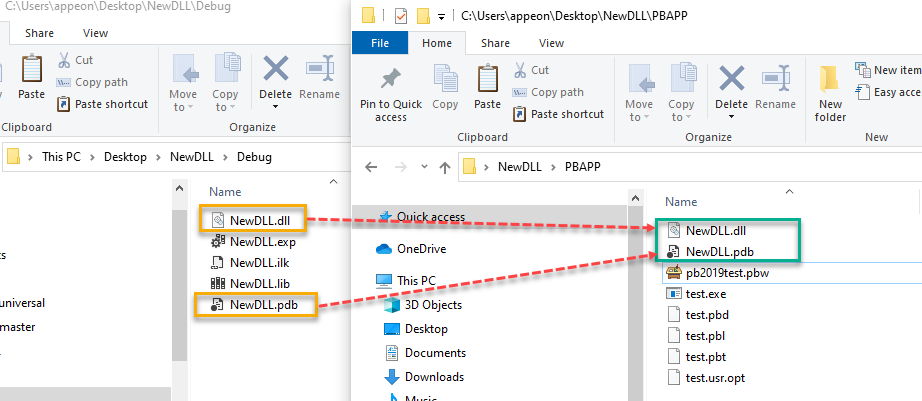
For example, when debugging the NewDLL.dll called by PowerBuilder
application, the corresponding NewDLL.pdb file should be copied to the
same PowerBuilder application directory. Please also note that such
NewDLL.pdb file is not necessary when deployed to the end users.
Debug by Attach to Process
1. Open the current application with PowerBuilder IDE and run the
application to see the application window.
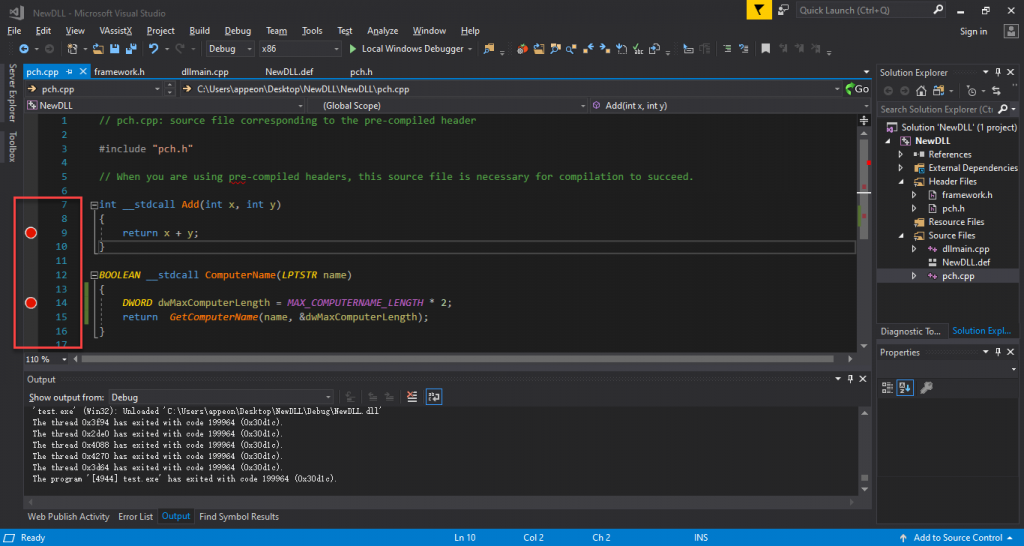
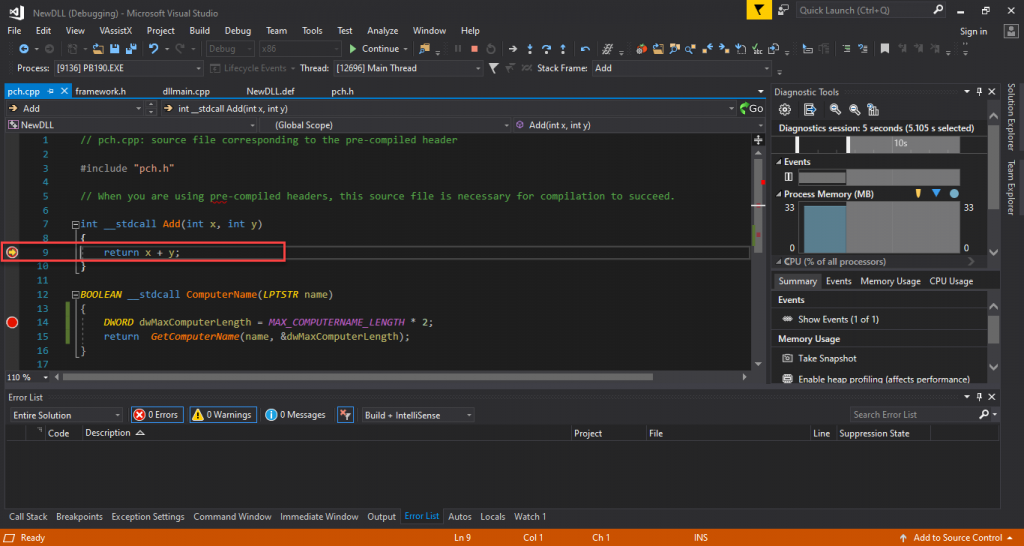
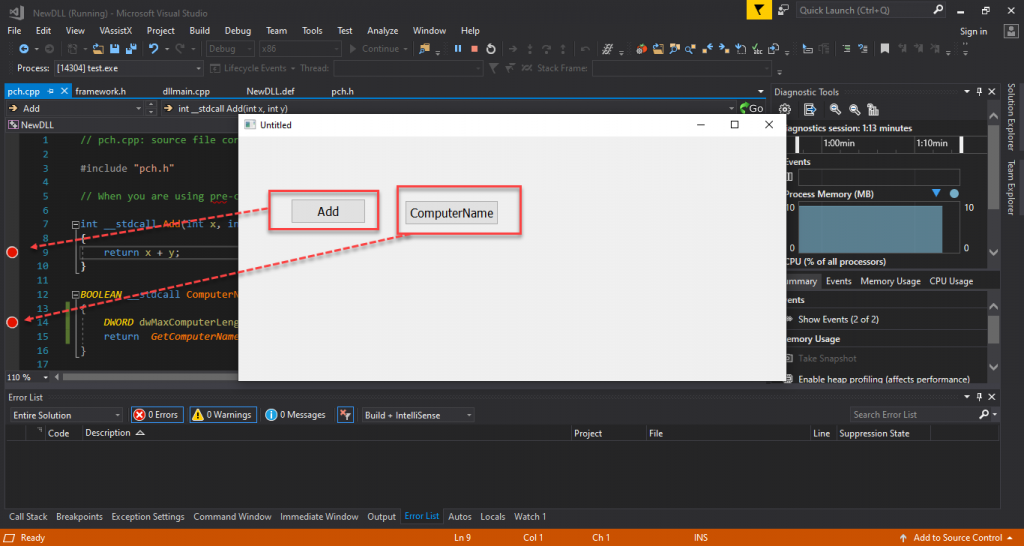
2. Open the current NewDLL project with Visual Studio 2017 and set
the corresponding breakpoints.
As shown in the screenshot below, set breakpoints on the 9th
and the 14th lines of the code in the pch.cpp file.
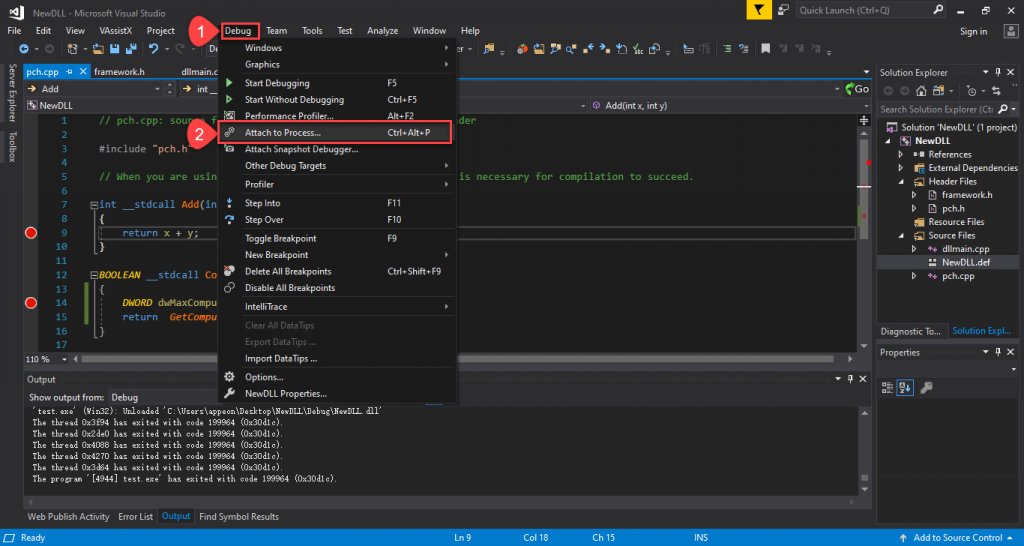
3. In Visual Studio 2017, select menu Debug -> Attach to
Process….
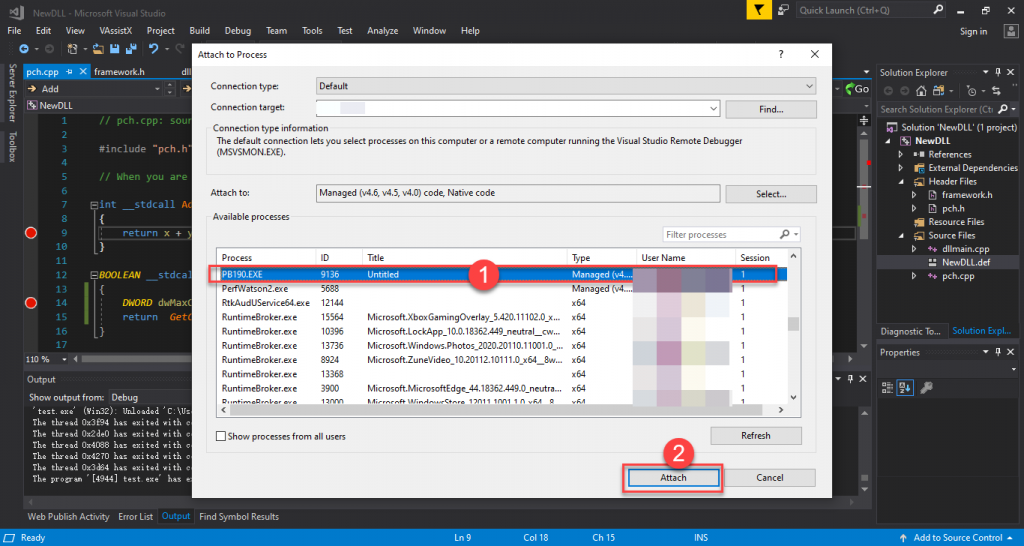
4. In the Attach to Process window, attach the current
PowerBuilder 2019 process.
Then in the process list, select PB190.exe, click the Attach
button to start the monitoring.
5. Click the Add or ComputerName button in the PowerBuilder
application to call the functions Add or ComputerName in
NewDLL.dll.
When you click the Add or ComputerName button in the PowerBuilder
application, the PowerBuilder application will call the Add or
ComputerName function in NewDLL.dll and Visual Studio 2017 will
automatically capture and call the current function and the execution of
code will pause at the breakpoint. At this moment, you can do
independent debugging in Visual Studio 2017.

Debug using the command
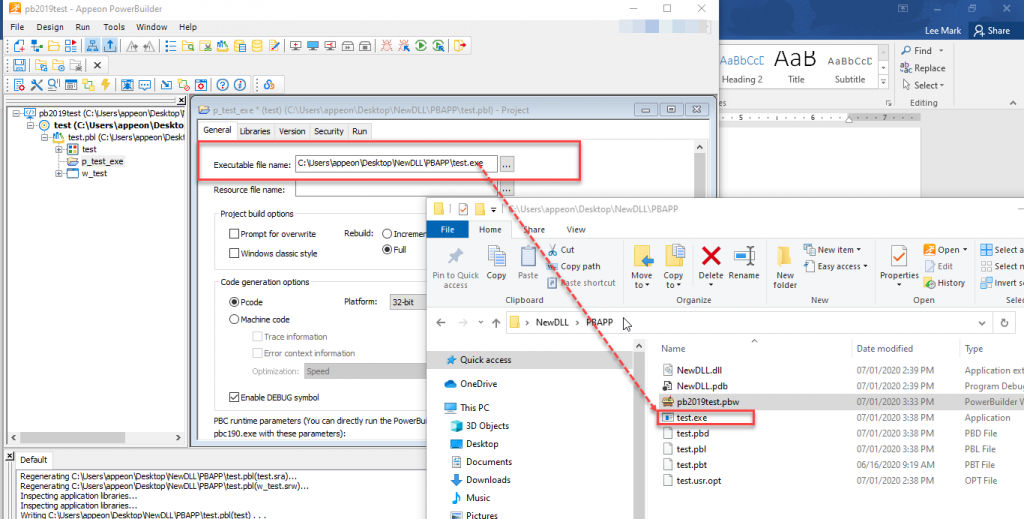
1. First we need to deploy the current application in PowerBuilder
to generate the exe program.
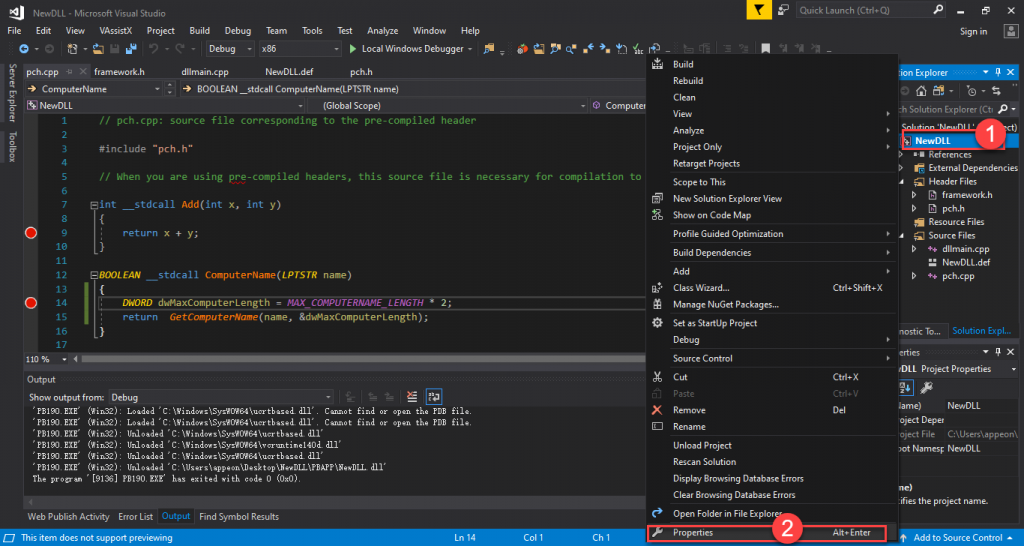
2. In Visual Studio 2017, right-click on the current project and
select Properties.
3. In the pop-up Properties window, add the path of the current
exe file compiled by PowerBuilder application to the Command
property.
Click the OK button to confirm the current settings.

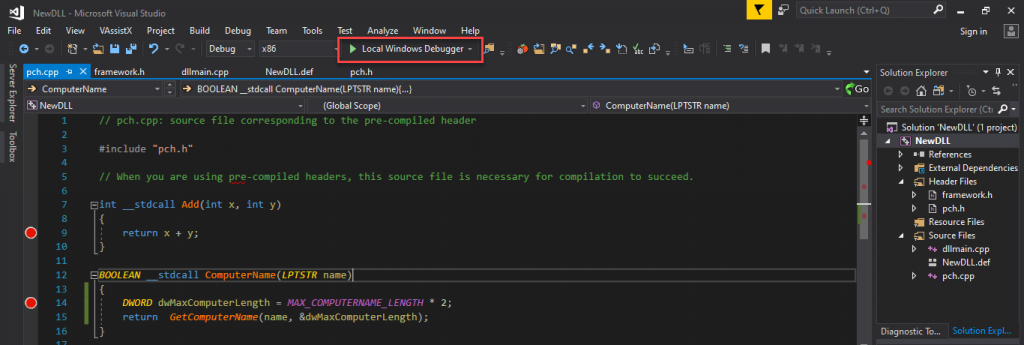
4. Set the breakpoints for corresponding functions.
5. Execute the local Windows Debug function.
Press the F5 key to start the local debug function.
6. On the application window, click the Add or ComputerName
button.
Click the Add or ComputerName button to call the Add or
ComputerName functions in NewDLL.dll.
7. At this moment, Visual Studio 2017 will automatically capture
the functions called and the execution of code will pause where you set
the breakpoints.
Please note that it is not possible to launch the PowerBuilder
2019 process automatically if the pb190.exe path is set directly in the
Command property of Visual Studio 2017’s project properties to perform
the debugging. PowerBuilder 2019 has disabled this feature for security
reasons.